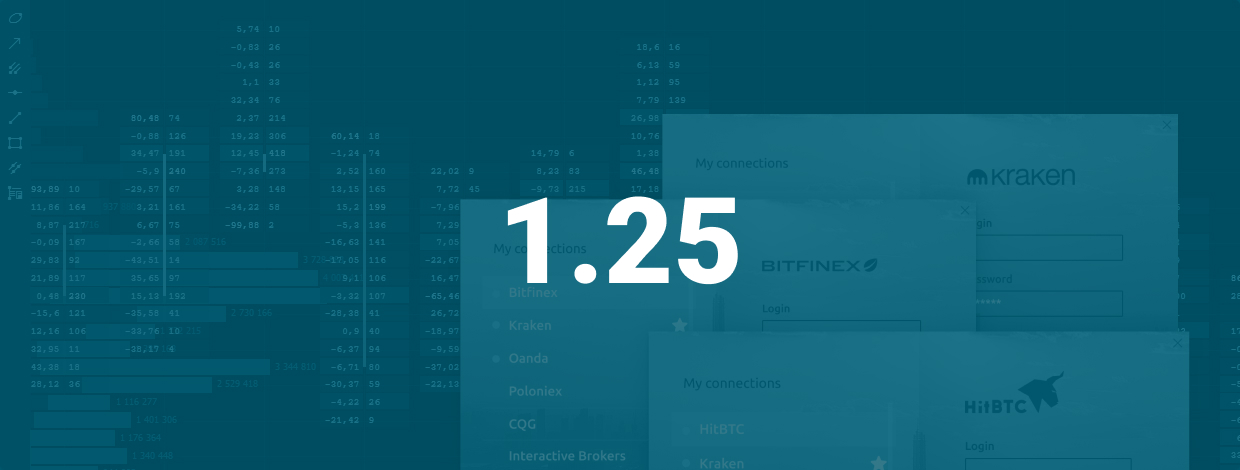
Volume analysis tools, Kraken, Bitfinex, and HitBTC are in Quantower. A massive update is already here!
Навігація
If you follow the development process of our platform, you probably know that since the last update passed less than a month. You’d better get a hold on something because we have prepared a very large release with several connections, valuable analytical features, useful improvements, and fixes.
Volume analysis tools
Quantower trading platform provides Volume Analysis Tools, an advanced analytical functionality, which allows you to see the traded volume at each price level, assess the balance between buyers and sellers and understand the intentions of traders regarding the future price.
Volume analysis tools include proprietary and well-known analytics:
- Cluster Chart (a.k.a. Footprint chart or OrderFlow chart)
- Volume Profiles — Step, Right, Left and Custom volume profiles
- Time Statistics — volume data per each bar in table form
- Time Histogram — volume data per each bar in the form of a vertical histogram
- Custom VWAP (Anchored VWAP) — can be attached to any selected bar as a starting calculation point
- VWAP — multiple VWAP lines for a single chart
- Historical Time & Sales — the table of all trades for the any selected bar
Cluster chart
As you know, regular chart types (candlestick, bar etc.) are limited to displaying only OHLC data. In this case, the most important data - the trade volume and its distribution at price levels - are hidden. Cluster chart shows the distribution of volume data within each bar, namely:
- trading volume
- number of trades
- the distribution of trades by Ask or Bid prices
- delta, the difference between the number of trades by Bid or by Ask
- custom filters for trading volume and trades
- and even more
As a result, you literally look inside the chart and can clearly assess the intentions of market participants.
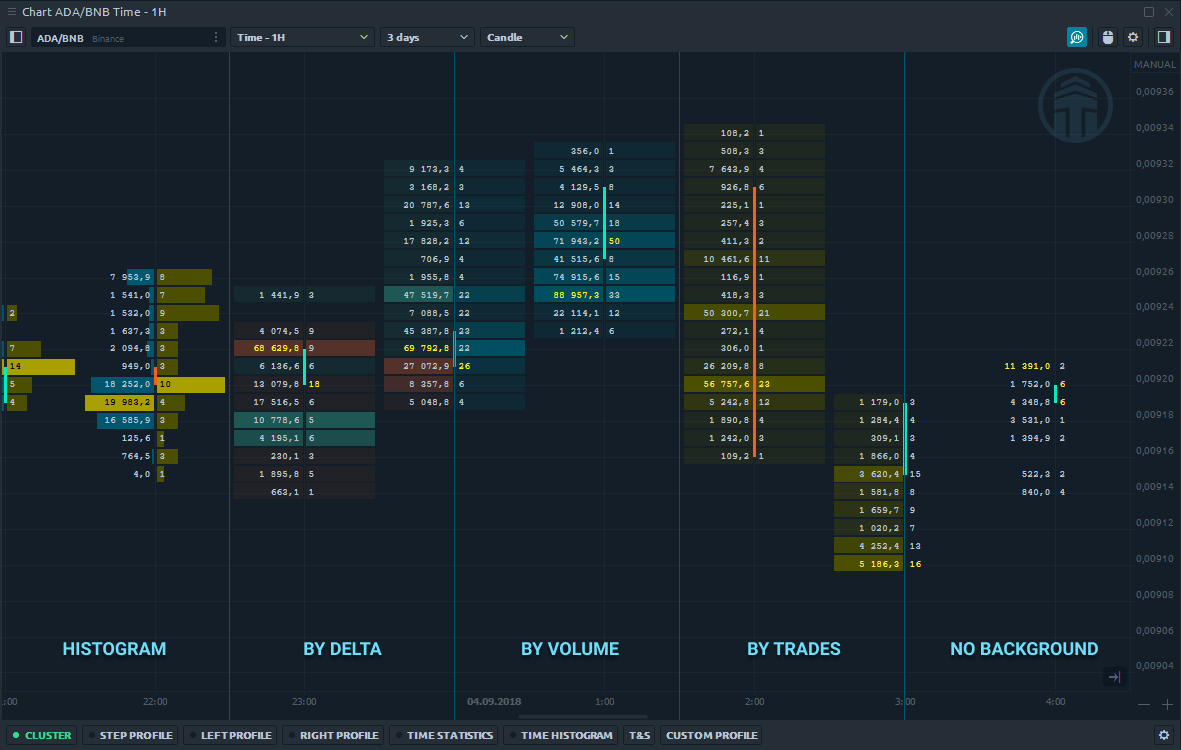
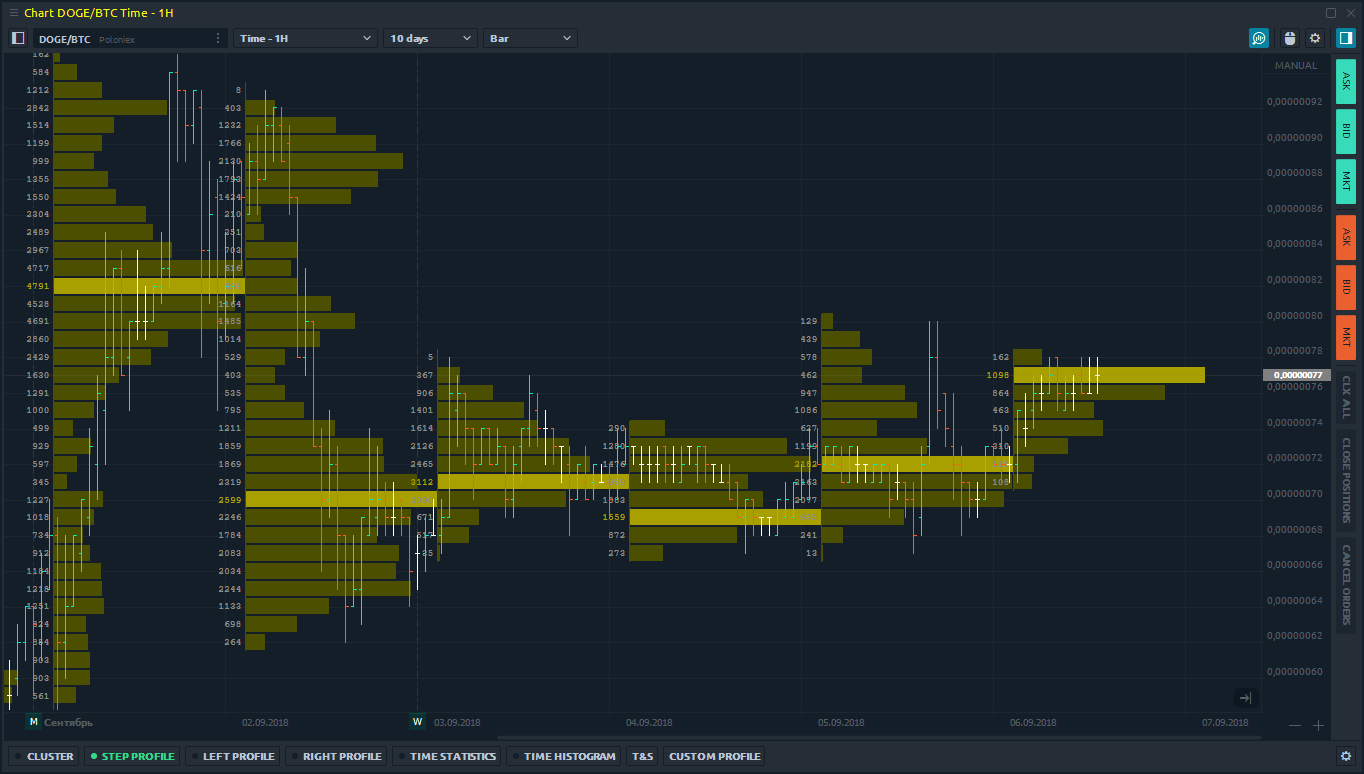
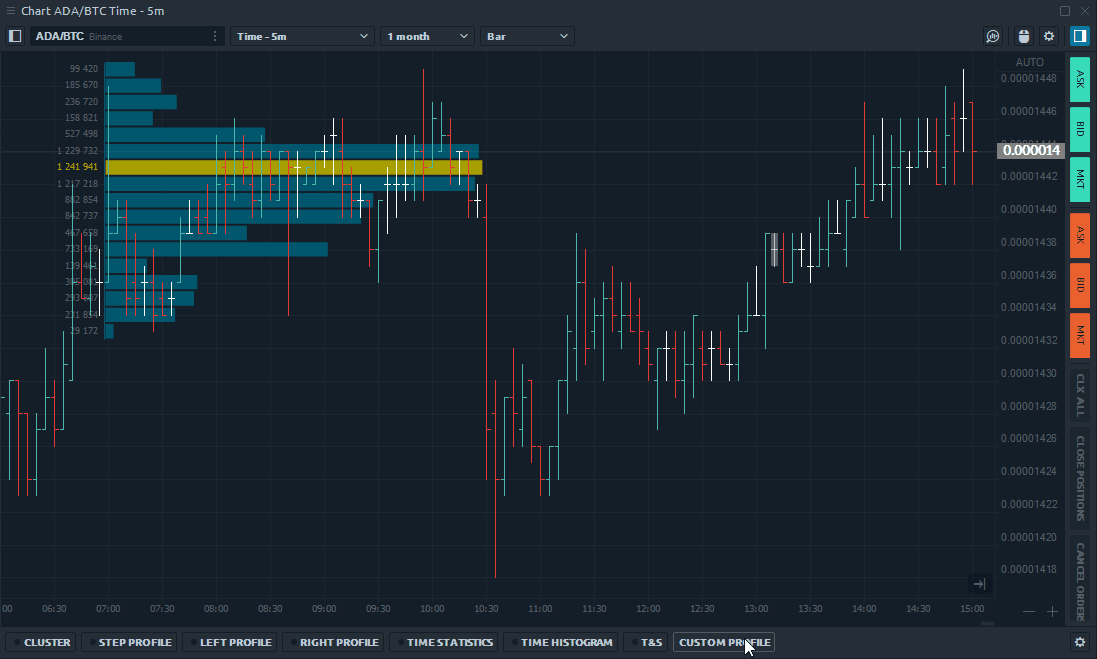
Volume profiles
Volume profiles are horizontal histograms that show the distribution of selected volume data for each price level. This allows you to more accurately see the zones of maximum trading interest, and as a consequence, the "true" support/resistance levels. In the Quantower platform, we have several types of profiles:
- Left and Right volume profile can be placed on the left and right side of the chart respectively. For example, you can set the delta data on one profile, and on the other the total volume for the same period of time. You can combine several profiles that are built on different time periods into one combo profile and put it on left or right chart position. We provide you with the full flexibility of the settings for these profiles.
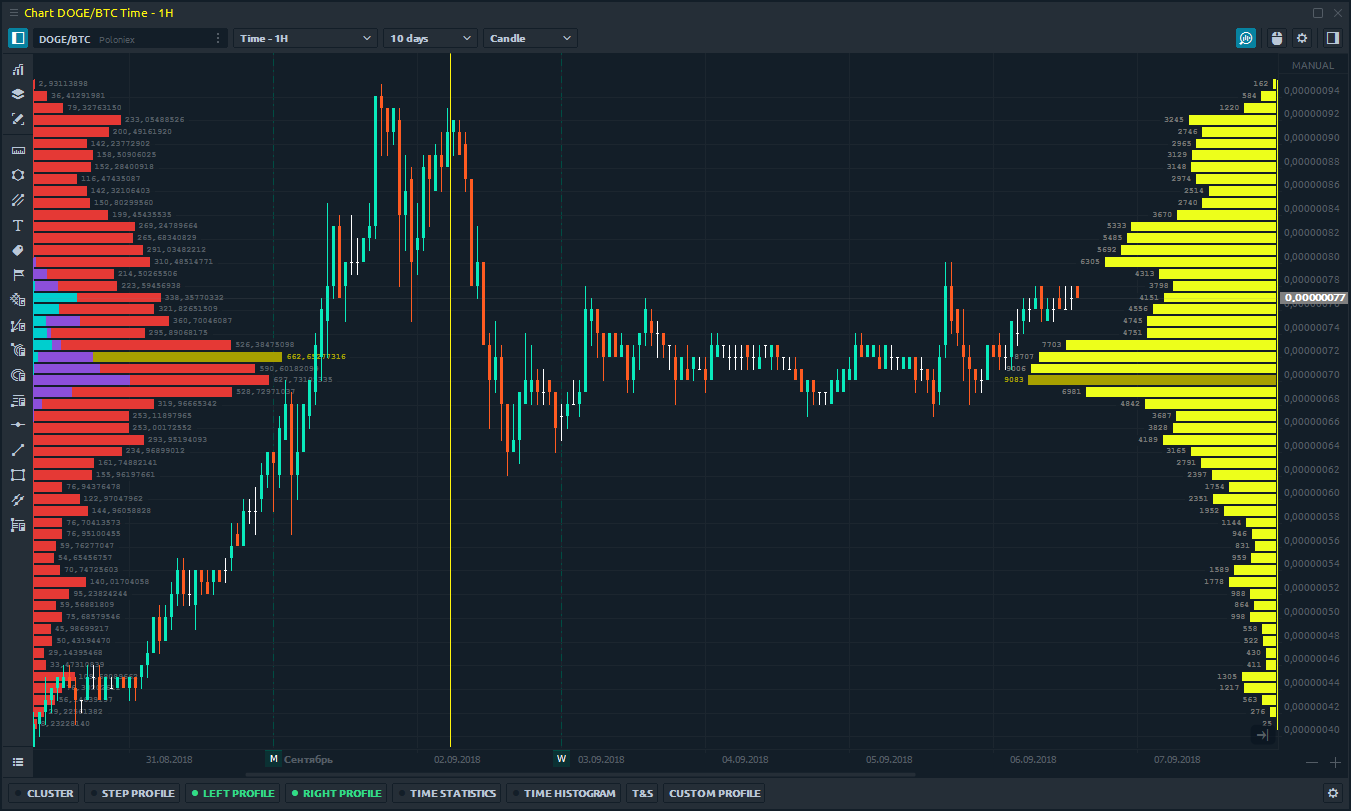
- Step profile displays volume profiles with a certain time step.
- Custom profile allows you to build a profile on any time range. For instance, you want to see the distribution of the delta on the flat chart or for the impulse bar.
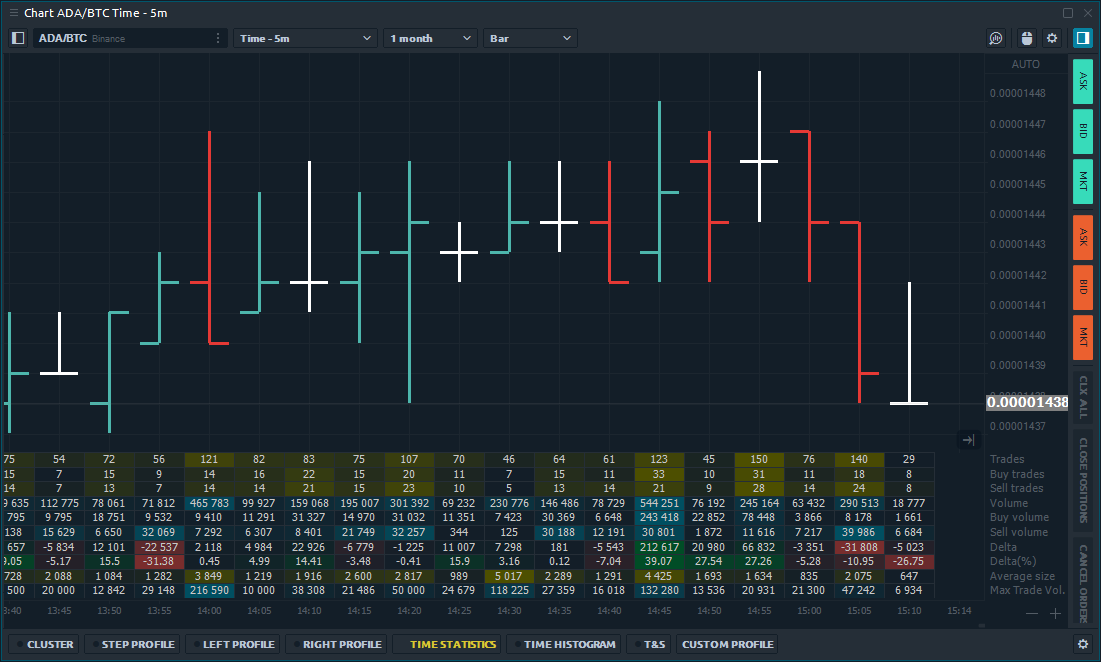
Time statistics
It’s a remarkable functionality that shows extended volume statistics for each individual bar — Total volume, Trades, Buy and Sell volume, Delta, as well as custom filters. For example, you can see how many buy or sell trades have passed in one candle from the total trading volume, assess the delta and the average trade size.
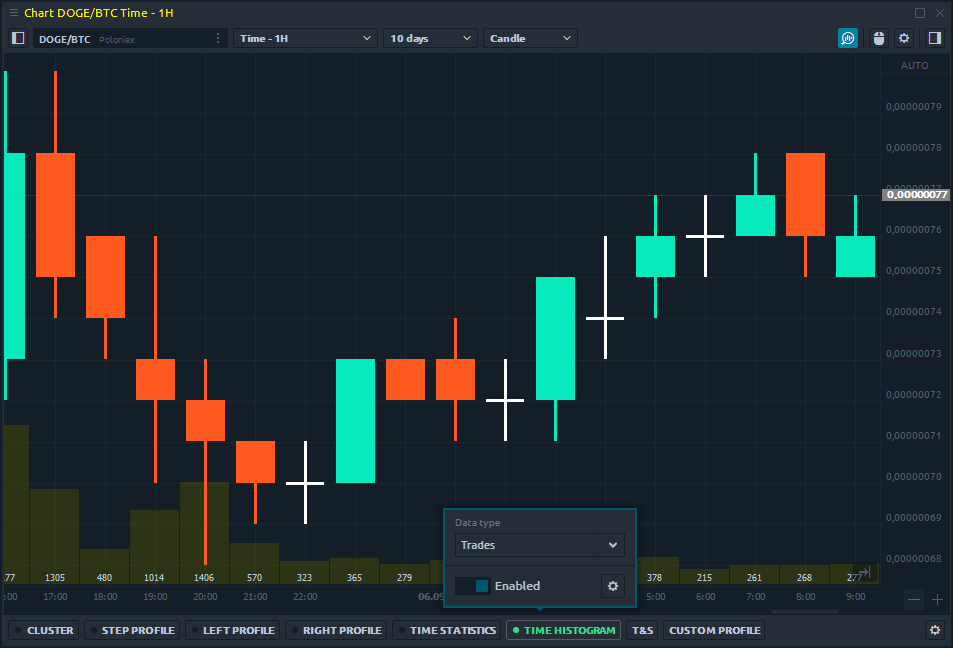
Time histogram
It's a similar feature to Time statistics that shows volume data as a vertical histogram for each individual bar. But unlike Time statistics, it allows you to visually evaluate the data for each bar, not only by colors but also by the shape of the histogram.
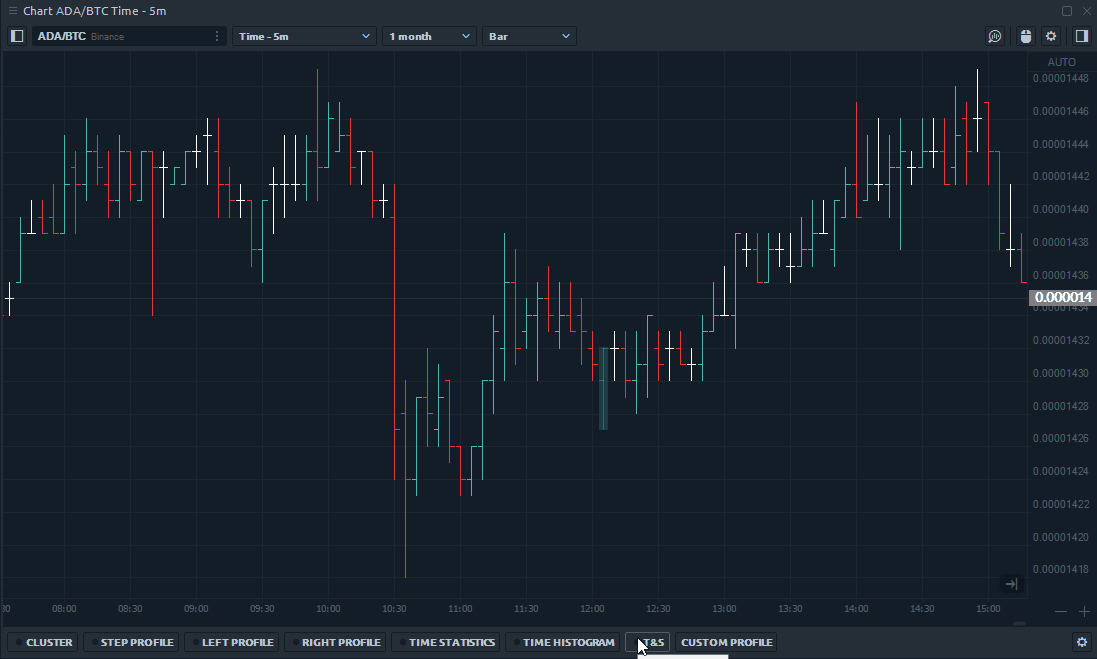
Historical Time & Sales
If you want to see how the trades distributed in a particular bar, then the Historical T & S will be indispensable. By selecting any bar, you will see all the trades from the first second. In this case, you can set up filtering to display data with a certain volume or apply to sort by price, volume, etc.
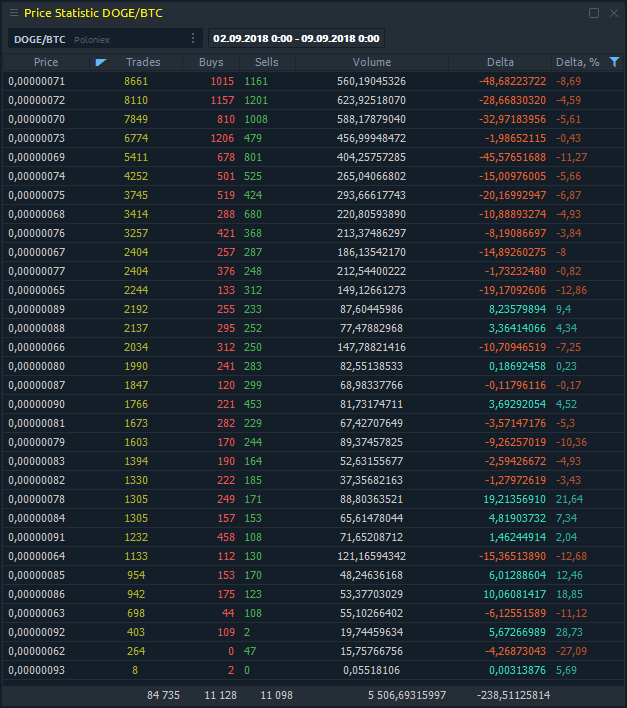
Price Statistics panel
This panel is an excellent addition for traders who prefer volume analysis. It shows aggregated data on volumes and trades for a specified period at each price level. This functionality is very similar to the Volume Profile, except for the data displays in a tabular form, which can be exported to external files for further analysis.
Kraken, Bitfinex, HitBTC are already available
In this release, we decided to add three crypto exchanges — Kraken, Bitfinex, HitBTC — which (so far) will be available as market data providers. Using their data, you can test your trading systems using History Player. Previously we showed how to operate a History Player panel using the example of FX connections in our article.
Also, you can compare prices for crypto assets on different exchanges, using a simultaneous connection.


Коментарі