Volume analysis tools
See what price alone can’t show. Analyze volume at price, compare buying and selling activity, and explore the trades behind each move with professional order flow tools built directly into Quantower
See Where Trading Activity Happens
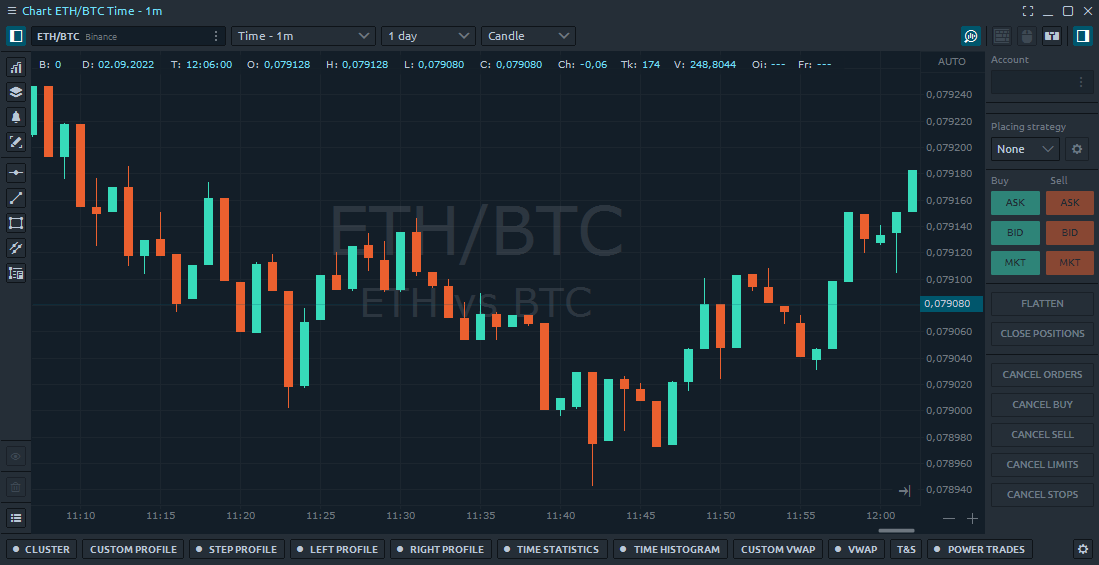
Candles show where price moved. Volume shows where trading took place — which levels attracted activity, how buyers and sellers interacted, and where the balance began to shift.
Start with the broader volume picture, then move deeper into activity inside each bar and the trades behind it.
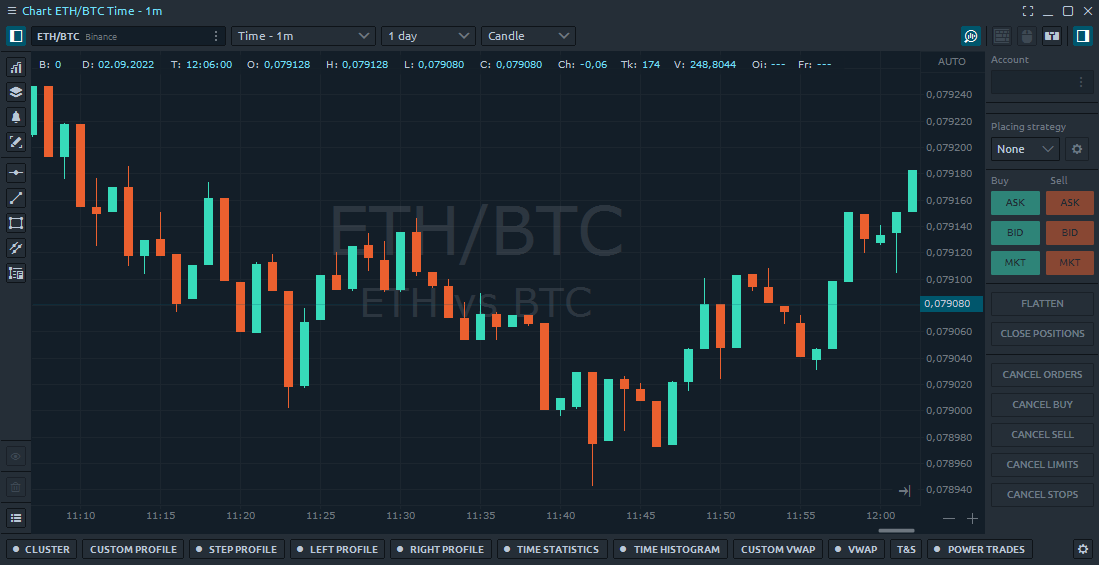
Volume Analysis From Profile to Footprint
Use different views of the same market activity without losing context
Footprint / Cluster Chart
Look inside each candle and see how volume traded at individual price levels. Compare Bid and Ask activity and highlight buying or selling imbalances where they occur
Volume Profile
Map volume across price and quickly see where trading activity is concentrated. Highlight high-volume areas, POC and Value Area to understand the distribution at a glance
Delta & Cumulative Delta
See which side is more aggressive, not just how much volume traded. Use Delta bar by bar or Cumulative Delta to follow how that balance changes as price moves
VWAP & Anchored VWAP
Keep a volume-weighted price reference directly on the chart. Use VWAP for the trading period or anchor it to a specific bar or event for a more focused view
Time Statistics & Histogram
Review volume activity from bar to bar with detailed statistics or a visual histogram
Historical Time & Sales
Go behind a historical bar and inspect the trades that formed it by price, volume and execution sequence
Switch Between Volume, Delta and Trade Data
The same price action can reveal different information depending on the data you use. Switch between Volume, Buy/Sell Volume, Delta, Cumulative Delta, Trades, trade size and other available data types to focus on what matters to your analysis.
Use the same data across Quantower’s Volume Analysis tools without rebuilding your chart.
VolumeBuy/Sell VolumeDeltaCumulative DeltaTradesAverage Trade SizeMaximum Trade SizeFiltered Volume
Build Volume Profiles for the Range You Need
Profile a full session, a recurring period, or one specific range on the chart
Step Profile
Build profiles automatically by minute, hour, day, week or month
Left & Right Profiles
Compare different periods or volume data within the same chart
Custom Profile
Select the exact range you want to study
POC & Value Area
Highlight the price level with the highest volume and keep the key parts of the distribution clearly visible
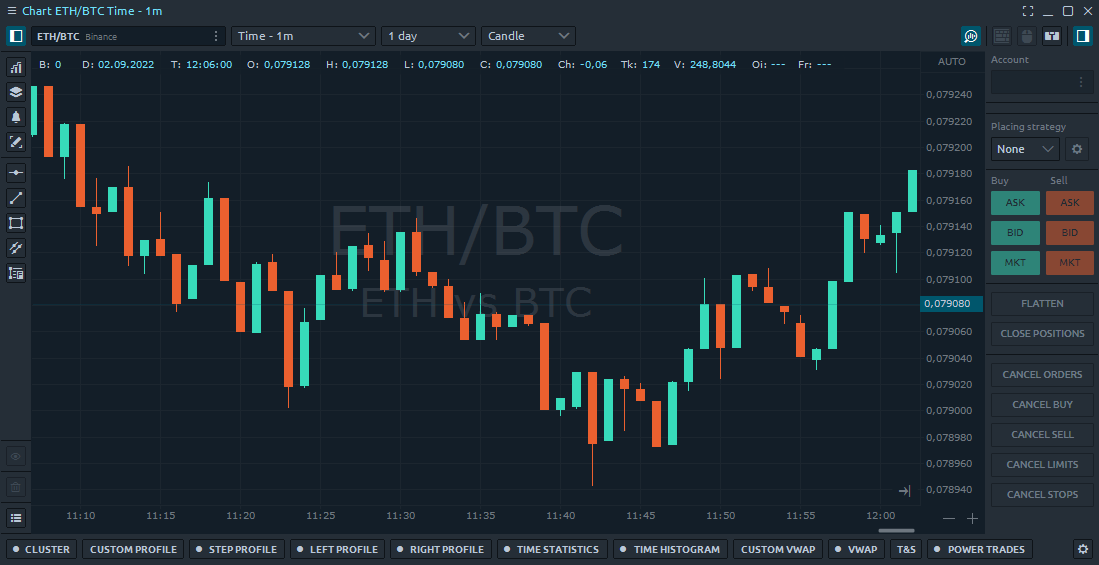


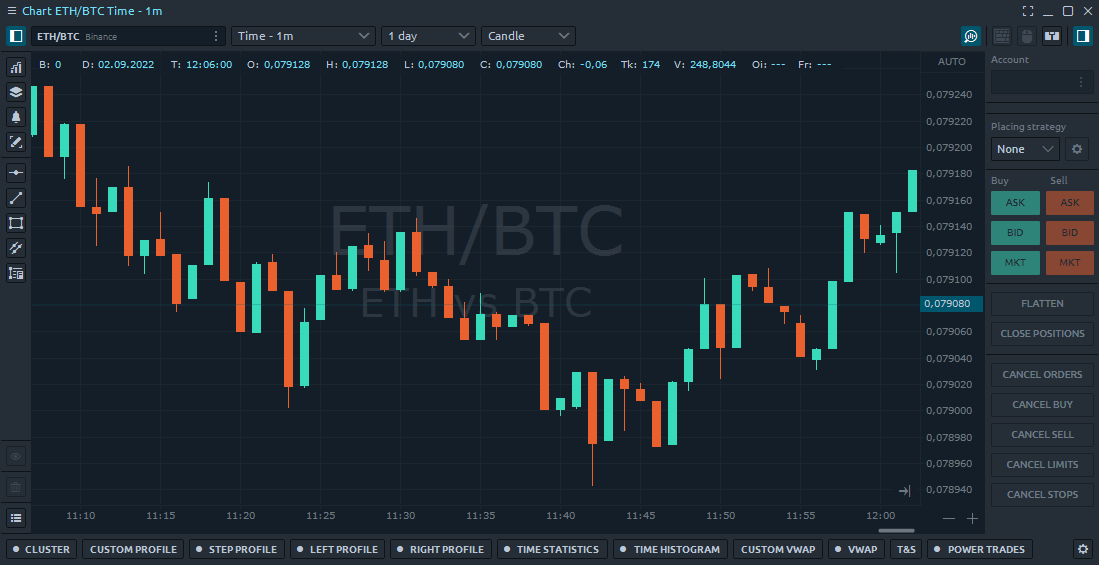
Keep Analysis Connected to Execution
Move from market-wide volume context to Footprint detail and historical executions without leaving your trading workspace.
Build the workspace around the way you trade — all inside one customizable Quantower environment.
Free Download View Pricing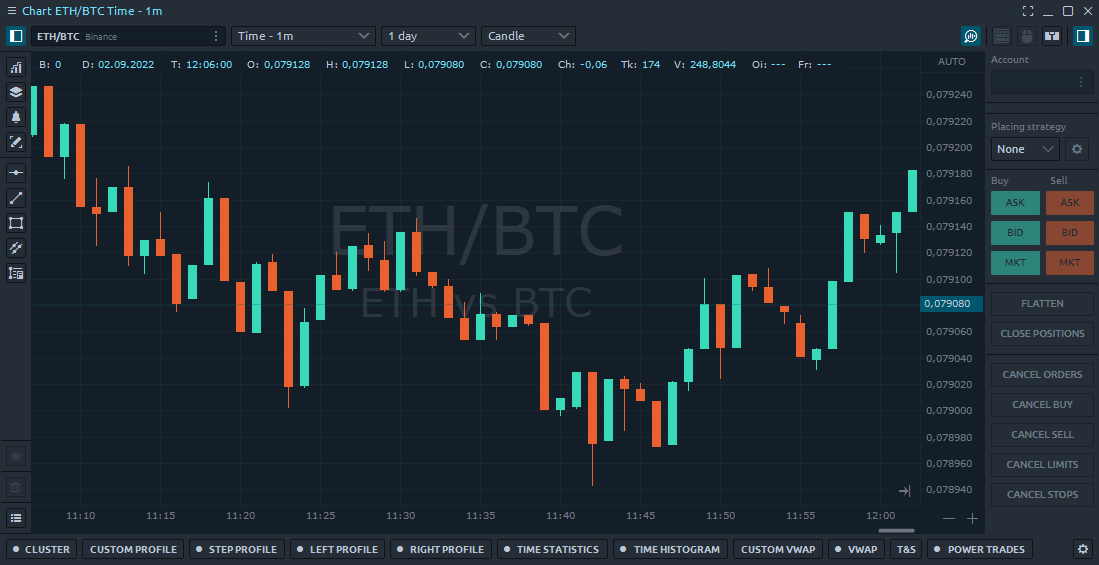
Volume Analysis FAQ
What is volume analysis in trading?
Volume analysis combines price with traded volume to show where activity is concentrated and how participation changes as the market moves.
What volume analysis tools are available in Quantower?
Quantower includes Footprint / Cluster Charts, multiple Volume Profile types, Delta and Cumulative Delta, Time Statistics, Time Histogram, VWAP, Anchored VWAP and Historical Time & Sales.
What is the difference between Volume Profile and Footprint?
Volume Profile shows how volume is distributed across price over a selected range. Footprint goes inside each bar and shows executed activity at individual price levels.